

New service
The state of any parcel, from space — no trip to the field.
Draw your parcel on the map or upload its geometry (shapefile, GeoJSON, KML, GPX) and get a complete agronomic report: satellite vegetation, soil analysis, the season’s climate, terrain and an AI-written interpretation. Pay per hectare, once, or put it under monthly monitoring.
No install. Result in minutes, by email.
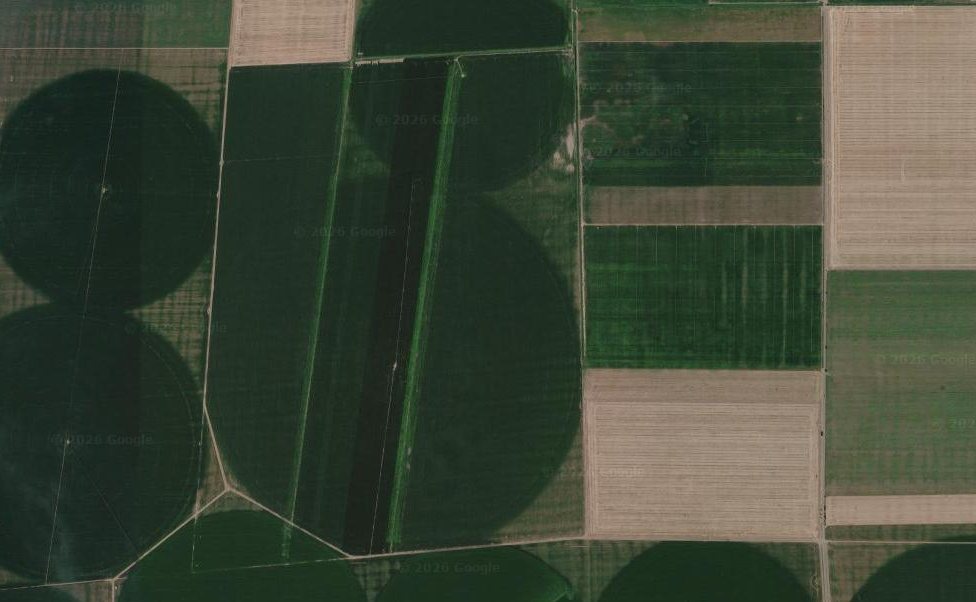 good · 19.1 hamedium · 44.6 haweak · 23.1 ha
What analyses the report contains
Every analysis of a parcel, in a single report
Every report automatically runs dozens of analyses on your parcel — vegetation, soil, climate, terrain — checks them and sums them up with AI, with no GIS software. Here is what you learn and what it is worth.
Satellite vegetation
What you learn: The crop’s evolution across the whole season, from multispectral imagery: vigour and health indices (NDVI, leaf moisture, biomass, leaf nitrogen, leaf area) at every clear pass, by crop stage, with maps of the parcel and the phenology (emergence → peak → ripening).
Why it matters: See where and when the crop falls behind or is stressed before the eye can — and know exactly which area to check in the field.
Soil analysis
What you learn: The arable-layer profile (0–30 cm): texture (clay/silt/sand), pH, organic carbon, nitrogen, nutrient-holding capacity and density — each with an agronomic reading and recommendations.
Why it matters: Learn a parcel’s fertility and water-holding capacity without lab tests — useful before a crop, fertilisation or buying land.
Season climate
What you learn: Water balance (rain vs. consumption), accumulated growing heat, drought spells and heat-stress or frost days — broken down by the crop’s critical stages, with daily and monthly values.
Why it matters: Understand why a crop did or did not do well — drought, heat, frost — on your parcel’s real climate, not the regional average.
Parcel terrain
What you learn: Slope, aspect and the parcel’s position in the landscape, linked to drainage and microclimate.
Why it matters: Explains where water pools or the soil dries fast and helps with field-work and irrigation decisions.
Interpretation & actions (AI)
What you learn: An overall season verdict, a reading of each topic (soil, climate, vegetation) and a list of priority actions — all in plain language.
Why it matters: You get the conclusion and the next steps, not just numbers — as if an agronomist had read all the analyses for you.
Good / medium / poor zones
The parcel is split into vigour zones from satellite, with maps in the PDF — see exactly where yield is lost.
Automatic audit + source confidence
Every statement is checked, and the report tells you how reliable the data is (clouds, resolution).
A PDF ready to print or send
A complete document, with charts, tables and maps — for a file, a bank or talks with partners.
From data to decisions
Not just data — what to do next
The report doesn’t just give you numbers; it tells you how the field stands and what to do — in plain language.
Traffic-light status + priority actions
Your parcel’s status at a glance (green / amber / red) and the first things to do now.
Variable-rate by zone
Where to concentrate nitrogen, proportionally by zone, from the nitrogen signal (NDRE) — indicative, not a fixed dose.
Estimated yield (indicative)
Harvest potential, from vegetation versus the crop’s typical level.
Irrigation need
Soil water and the current deficit — when it pays to irrigate.
Harvest window
When harvest is near, from satellite and crop maturity.
Uniformity and trend
How uniform the field is and whether it’s rising or falling between passes.
Everything in the report
Every piece of data in the report, section by section
A ~9-page PDF in plain language. Here is, section by section, exactly the data you get — nothing hidden.
Satellite maps
- The recent image of the parcel
- The vegetation map (NDVI)
- The vigor-zone map (good / medium / weak)
Crop evolution over the season
- Vegetation (NDVI) period by period — chart + table
- The crop stage at each moment
- Leaf moisture
- Rain and min / max temperatures
- Water balance and growing degree-days
- Notes for each period
Key crop moments
- Sowing (estimated)
- Emergence
- Peak vegetation
- Harvest
- Current crop status
Parcel zones
- How much is good / medium / weak (ha and %)
- Indices per zone (vegetation, moisture, nitrogen)
- Why a zone is weaker
- Color map of the zones
Weather across the season
- Rain and evaporation, month by month
- Water balance
- Minimum and maximum temperatures
- Accumulated degree-days
- Comparison with the multi-year normal
Parcel soil
- Texture (clay / silt / sand)
- Water behavior
- pH (acidity / alkalinity)
- Humus and nitrogen
- Nutrient-holding capacity
Terrain
- Elevation
- Slope and aspect
- Position relative to the surroundings
- Land cover
Parcel history by year
- How vegetation looked in each past year
- The summer crop pattern
- The long-term trend
Moisture and temperature
- Vegetation density, even through clouds (radar)
- Surface temperature — a heat-stress indicator
Agronomist's reading (AI)
- What it all means, month by month
- The season conclusions
- Recommendations for the next season
Confidence and audit
- Every statement automatically checked
- How reliable the data is (clouds, resolution)
- A PDF ready to print, for a bank or a file
Tracking evolution
Watch the crop grow, from space
The report turns every clear satellite pass into a season curve: you see the crop emerge, reach its peak and ripen — and you catch, early, any area that falls behind the expected growth.
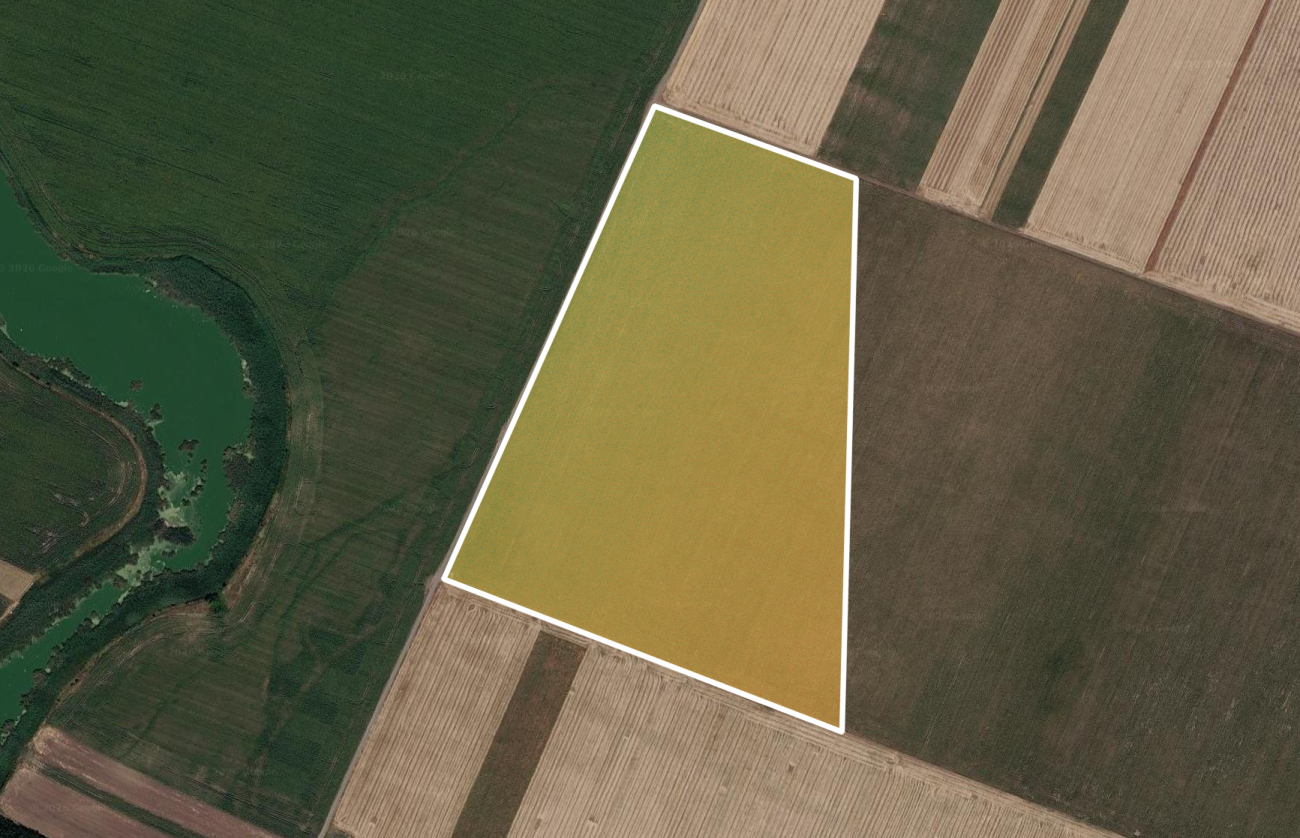
What you learn, stage by stage
- 1
Sowing & emergence
Whether the crop came up evenly, or there are patchy, slow or bare areas to re-check.
- 2
Vegetative growth
Whether the crop builds canopy on schedule — and the first signs of water or nutrient stress.
- 3
Flowering & peak
The season’s peak vigour and the zones that stay behind in the most yield-sensitive phase.
- 4
Ripening & harvest
A natural decline (ripening), separated from real stress, with the right harvest window.
Pricing
Pay per hectare, once — or put it under monitoring
The area is computed geodesically from the parcel geometry. Minimum 1 ha.
Agronomic report
5,00 €/ha · one-off
Monthly monitoring
- 2× a month—
- 3× a month—
- 4× a month (~weekly)—
- 6× a month—
+ disease/stress alerts, optional
Prices are confirmed in the wizard before you order. Payment comes later — the order is registered now.
How it works
From parcel to report, in three steps
1. Pick the parcel
Draw it directly on the map or upload its geometry from a file: shapefile (.zip), GeoJSON, KML or GPX.
2. Choose what you want
A one-off report, monthly monitoring (2/3/4/6×) or both. See the price right away.
3. Get the report
The analysis runs in minutes and the PDF arrives by email. With monitoring, you also get the “what changed” alert.
Frequently asked questions
What you need to know
What decisions can I make from the report?
You get a traffic-light status + priority actions, variable-rate nitrogen by zone, a yield estimate, irrigation needs and the harvest window — not just numbers.
What is the agronomic parcel report?
A complete PDF on your parcel’s condition: satellite vegetation (NDVI), soil analysis, seasonal climate, terrain and an AI-written interpretation — with no field visit.
Where does the data come from?
From satellite imagery and public soil, climate and terrain models, processed for your parcel. No sensors to install and no need to walk the field.
How do I order and what geometry can I use?
Draw the parcel on the map or upload a geo file (shapefile, GeoJSON, KML or GPX). The area is computed automatically and geodesically — minimum 1 ha.
How much does it cost?
You pay per hectare, once, for a report. The minimum billable area is 1 ha. Optionally, you can put the parcel under monthly monitoring.
What is monthly monitoring?
The parcel is re-analysed automatically 2, 3, 4 or 6 times a month, with alerts when significant vegetation changes appear — so you catch problems early.
Which crops and areas does it work for?
Any farm parcel in Romania, for the current season and past years. The report adapts to the crop detected from satellite.
Order a report for your parcel
It takes a minute to pick the parcel. See the price before you confirm.